Nervecentre V9.0 Help for Users
Viewing flow metrics
You can view flow metrics.
Flow metrics are queries created by your organisation. Flow metrics return a number or list of items that meet a set of criteria. This might be a number of patients, entries, previous visits, or bed spaces.
Viewing flow metrics on a mobile
On a mobile, you can view a list of flow metrics from Live Flow. On a desktop, you can view the same list of flow metrics from your home dashboard. Nervecentre remembers any flow metrics you saved on a mobile or desktop. When you log in to Nervecentre on a desktop or mobile, you can view the flow metrics from your last session.
Read more about your home dashboard
 Overview of Live Flow
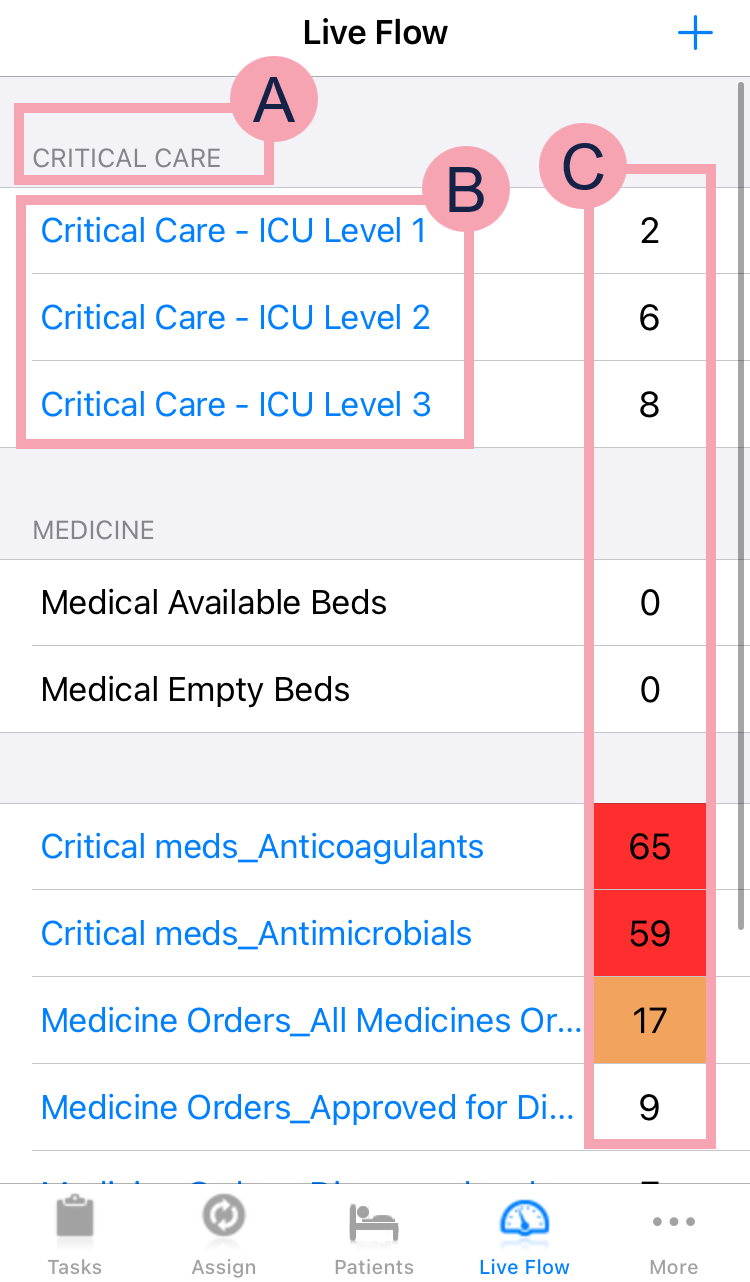
You can view a list of flow metrics from Live Flow. A flow metric is a query that returns a number or list of an item, for example, a list of patients or a number of bed spaces.
|
|
The name of a group of flow metrics. |
|
|
A list of flow metrics. If the name of the flow metric is in blue, you can select the name of the flow metric to view a list of patients. Read more about viewing a list of patients On iOS, you can select and hold on a flow metric to view the history of the flow metric. |
|
+ |
Select to add a flow metric. |
|
|
Shows the number of patients, entries, visits, or bed spaces that meet the criteria of the flow metric. The number might appear on an amber or red background. Your organisation can choose when the background becomes amber or red, for example, the background might turn amber if the number is greater than 5 and red if the number of patients is greater than 15. |


 Adding flow metrics to the list
You can choose the flow metrics you want to view.
On iOS
-
Select Live Flow.
-
Select +.
-
Select the flow metrics you want to view.
-
Select Live Flow to view the flow metrics.
On Android
-
From , select Live Flow.
-
Select +.
-
Select the flow metrics you want to view.
Select to search for metrics.
-
Select the back button on your mobile to view the flow metrics.
Viewing a list of patients from Live Flow
-
Select Live Flow.
-
On iOS, select Live Flow.
-
On Android, select > Live Flow.
-
-
To view the list of patients, select a flow metric with the name coloured blue
-
Select a patient in the list to view their patient record.
Viewing the history of a flow metric
You can view how a flow metric in your list has changed over the previous 7 days.
Every 30 minutes, the number returned the flow metric is recorded. In the flow metrics history, you can view what the number that was in the flow metric at the same point in time, today, yesterday, and 7 days ago.
On iOS
-
Select Live Flow.
-
Select and hold on the flow metric's name.
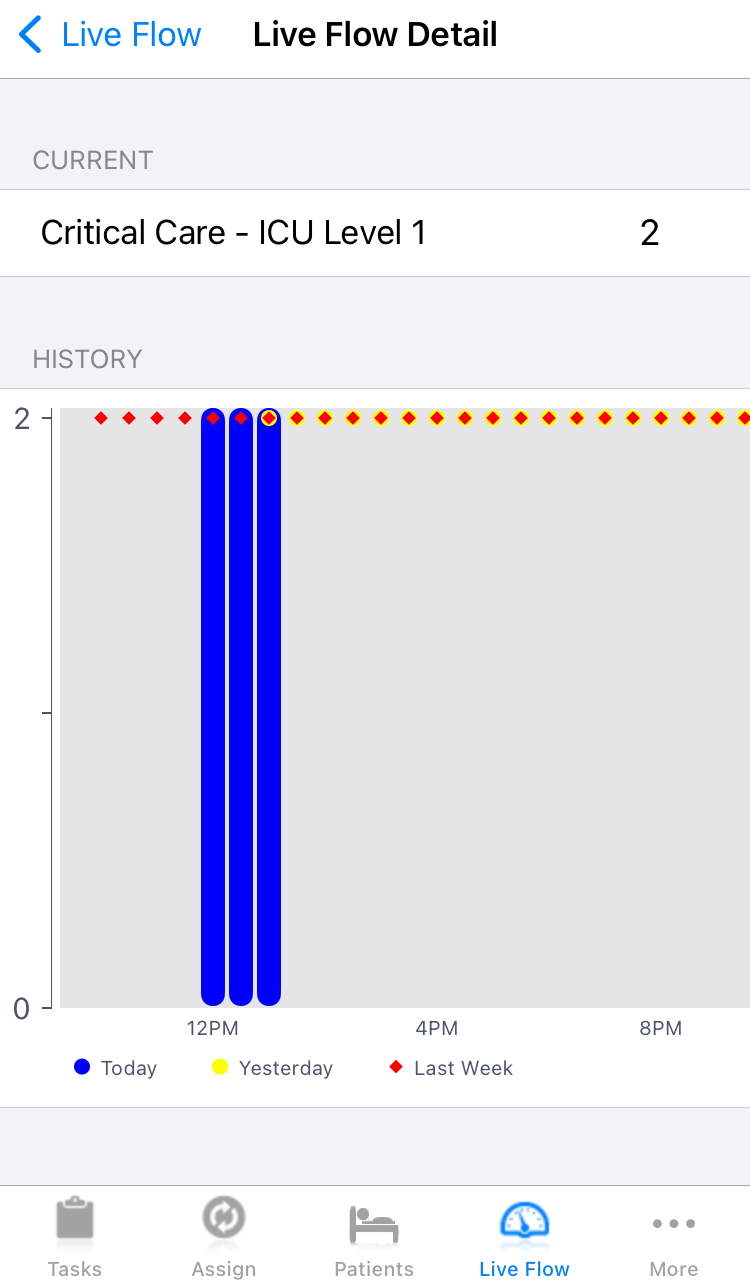
The history appears. The y-axis shows the number returned by the flow metric. The x-axis shows the time over 24 hours.
You can scroll left and right to view different hours.
-
The data for today is shown as blue bars
-
The data for yesterday is shown as yellow circles
-
The data for last week is shown as red circles
For example, the image below shows that the number in the flow metric is currently 2. The number in the flow metric was 2 at 1pm today, 1pm yesterday, and 1pm 7 days ago.
-
On Android
You can't view the history of flow metrics on Android.
Viewing flow metrics on a desktop
You can view flow metrics on your home dashboard, in worklists, and in live flows.
Read more about your home dashboard
Viewing a live flow
-
From Live Flow , select Live Patient Flow.
-
Select your live flow from the dropdown list in the top left corner.
Overview of Live Patient Flow
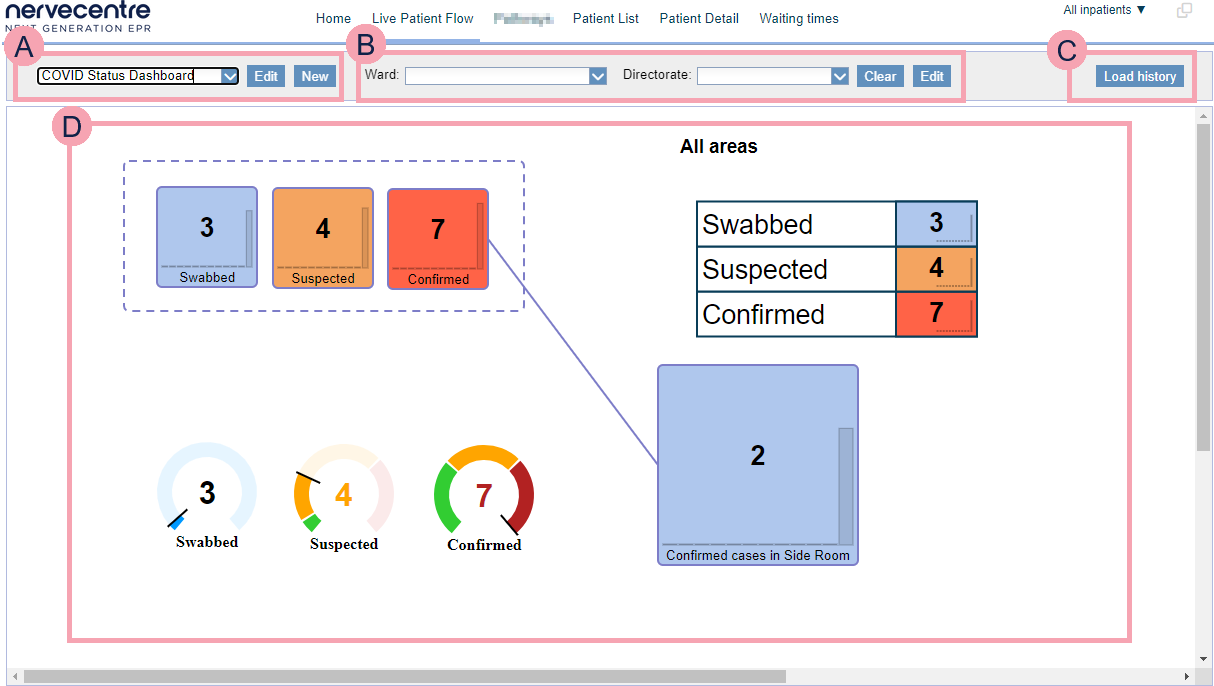
You can view flow metrics in an organised diagram called a live flow from Live Flow > Live Patient Flow.
|
|
Select a live flow from the list. If you have the correct permissions, you can create and edit live flows.
|
|
|
You can filter the live flow to just show information for a specific area:
|
|
|
You can view history the of the selected live flow or an individual flow metric.
|
|
|
The selected live flow appears here. Each flow metric shows a number. The number might have an amber or red indicator. Your organisation can choose when the flow metric becomes amber or red. For example, the flow metric might turn amber if the number is greater than 5 and red if the number of patients is greater than 15. When a flow metric is in a square box, you can see a bar chart behind the number. The bar chart shows you the number returned by the flow metric at 30 minutes intervals. The bar chart shows the last 5.5 hours of the flow metric's history. Double-click on a number to view a list of patients returned by that flow metric. If the flow metric is an expression, made up of multiple flow metrics, you might be able to view one of the flow metrics in the expression. |
 Filter a live flow to a ward or directorate
Some live flows are configured to be re-used across individual wards or directorates. This is useful for matrons or senior operational staff that are responsible for multiple wards or areas.
-
From Live Flow, select Live Patient Flow.
-
Select your live flow from the list.
-
Select Edit to add wards and directorates you can use for filtering.
-
Filter with the ward or directorate.
-
From Ward, select a ward to filter the live flow.
-
From Directorate, select a directorate to filter the live flow.
-
-
To revert the flow metrics back to their defaults, select Clear.
Viewing a list of patients from Live Patient Flow
-
From Live Flow, select Live Patient Flow.
-
Select your live flow from the list.
-
Double-click on a flow metric or number to view the list of patients returned by that flow metric.
Not all flow metrics return a list of patients.
-
Double-click on the patient's name to open the patient's record.
Viewing the history of a live flow
-
From Live Flow, select Live Patient Flow.
-
Select your live flow from the list.
-
Select Load history.
-
Drag the slider bar to find the date and time you want to see.
Viewing the history of a flow metric
You can view how a flow metric in your list has changed over the previous 7 days.
Every 30 minutes, the number returned the flow metric is recorded. In the flow metrics history, you can view what the number that was in the flow metric at the same point in time, today, yesterday, and 7 days ago.
-
From Live Flow, select Live Patient Flow.
-
Select your live flow from the list.
-
Select Load history.
-
Select .
-
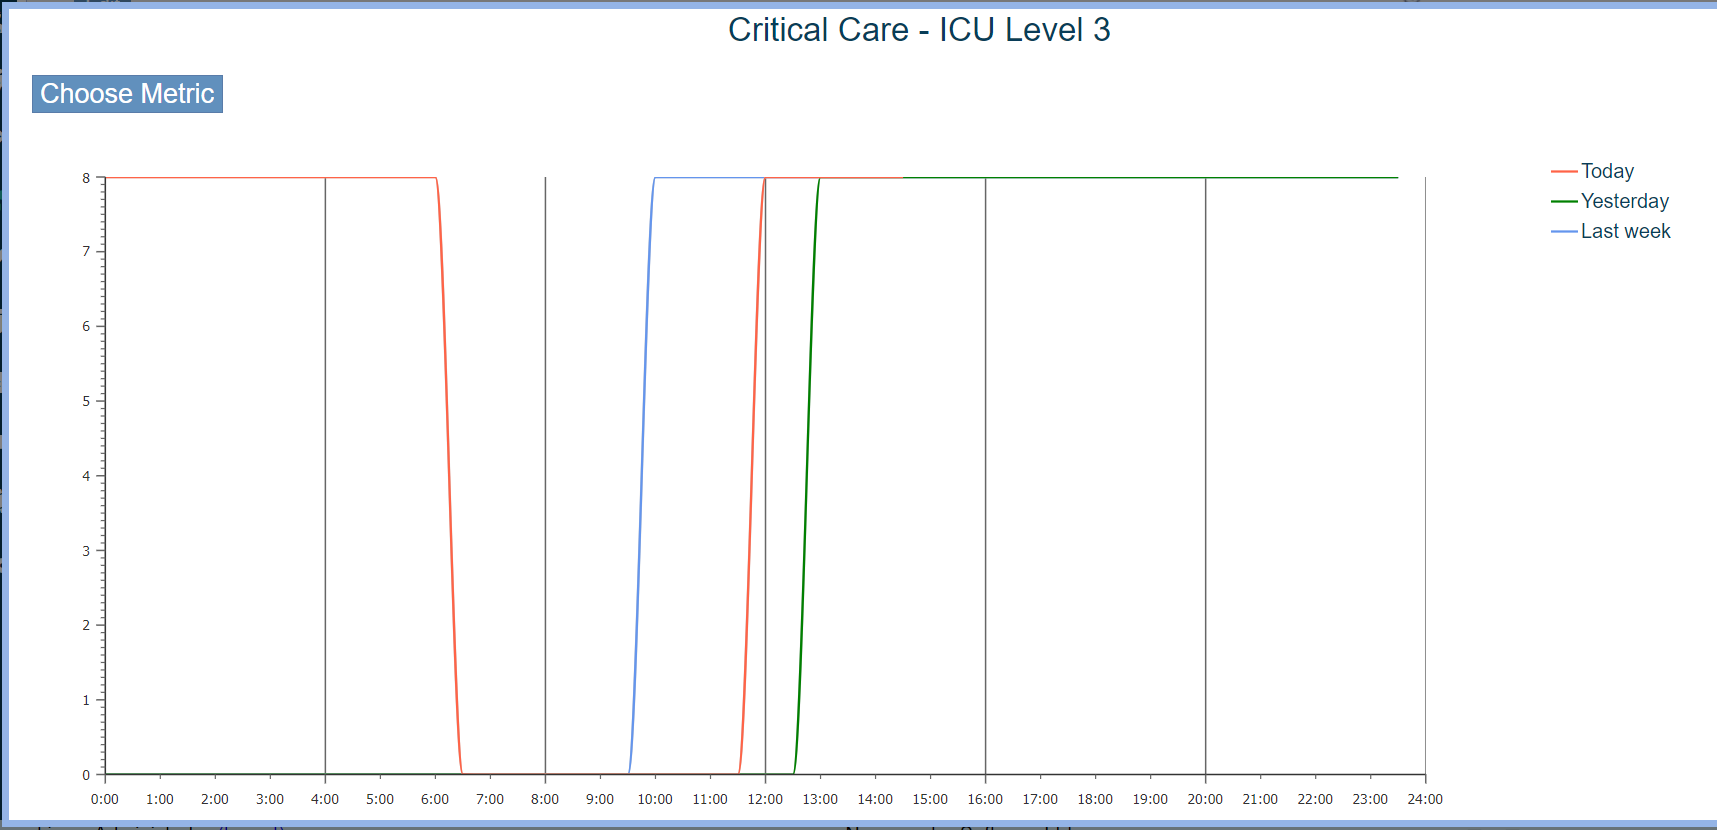
Select Choose Metric.
-
Select the metric you want to view. You can search for a metric.
The history appears. The y-axis shows the number returned by the flow metric. The x axis shows the time over 24 hours.
-
The data for today is shown by a red line
-
The data for yesterday is shown by a green line
-
The data for last week is shown by a blue line
For example, the image below shows that the number in the flow metric is currently 8. The number in the flow metric was 8 at 13:00 today, 13:00 yesterday, and 13:00 7 days ago.
-
Did you find this article helpful? Yes No
Sorry about that. Our help is a work in progress and we welcome any feedback.
Why wasn't this helpful? Please select one reason:
Great!
Thanks for taking the time to give us some feedback.